How to View the Analytics within Consensus Snap
View Analytics within Consensus Snap
In this part of Snap, you can now access detailed analytics customized for your specific user license. At the top, you can track the number of demos you’ve sent, how many were viewed, the total number of viewers, and your overall view rate.
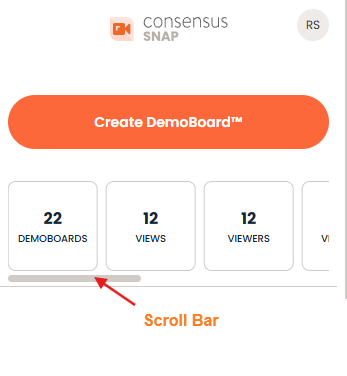 Slide the Scroll Bar to the right to show other Data
Below this section, you will find a comprehensive list of the demos you have submitted, including those sent via the main Consensus App and any submitted through Snap.
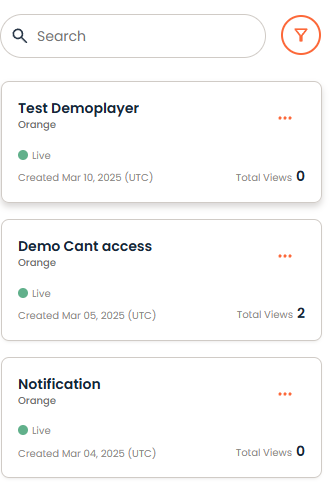 Click on the Demo to show the Analytics
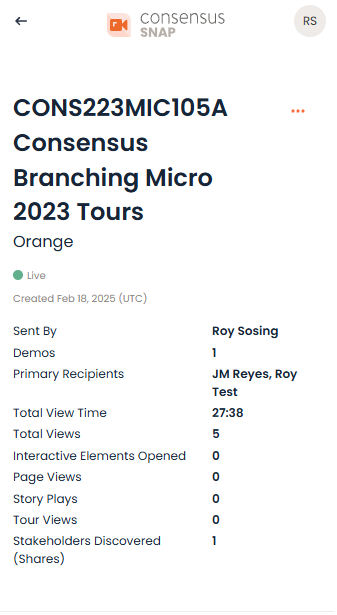
This part of the Analytics section will provide insights into key metrics such as Primary Recipients, Total View Time, Total Views, and Stakeholders Discovered.
In this section of Analytics, you will find information about the Recipients along with the total number of Views they have generated. Feel free to click on the recipients' names to explore more information about their interactions.
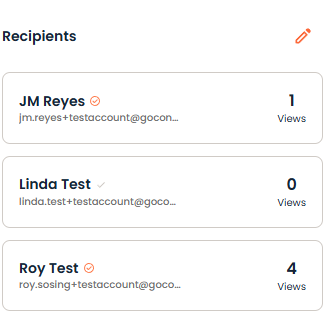 Click on the names for more details.
This section of Analytics provides an overview of recipient data. Additionally, if your Demo includes a Tour, you'll find the Tour Stats featured here as well.
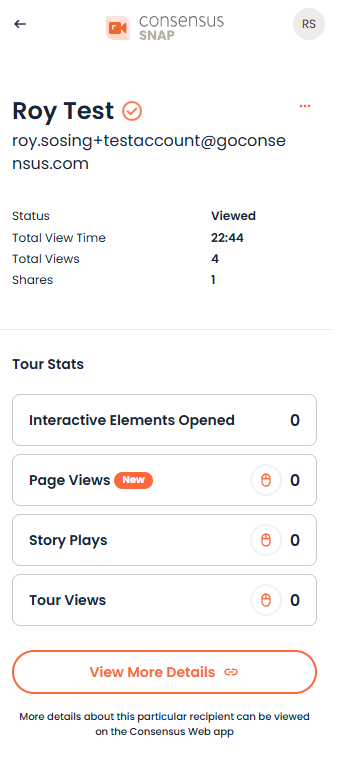 The “View More Details” button will take you to an in-depth analytics section within the Consensus platform.