The Consensus Salesforce app is a powerful integration that allows you as a Consensus user to show the actual value of your demos through the connection to Opportunity deal data. And now with the release of Consensus v11, it is now easier for you to create reports and dashboards to see the value and impact your demos have and how they are helping you close deals.
To get you started, here are some popular reports that can help you show just how impactful DemoBoards are when closing deals:
Opportunity Reports
Opportunity reports give us the greatest ability to tie your DemoBoards to deal success. For building Opportunity reports, we first recommend creating a Closed Won Opportunity report to start comparing the value of your closed won opportunities with and without Consensus to see the impact Consensus has on both deal size and deal age. Here’s how:
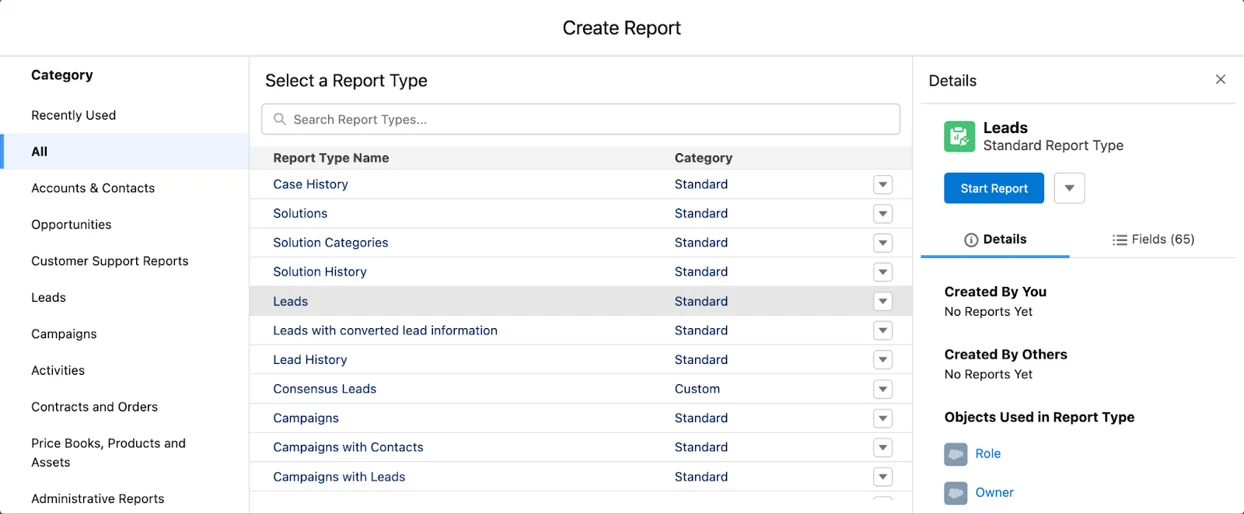
1. In Reports, click “New Report” and choose Opportunities as your Report Type and start your new Report.
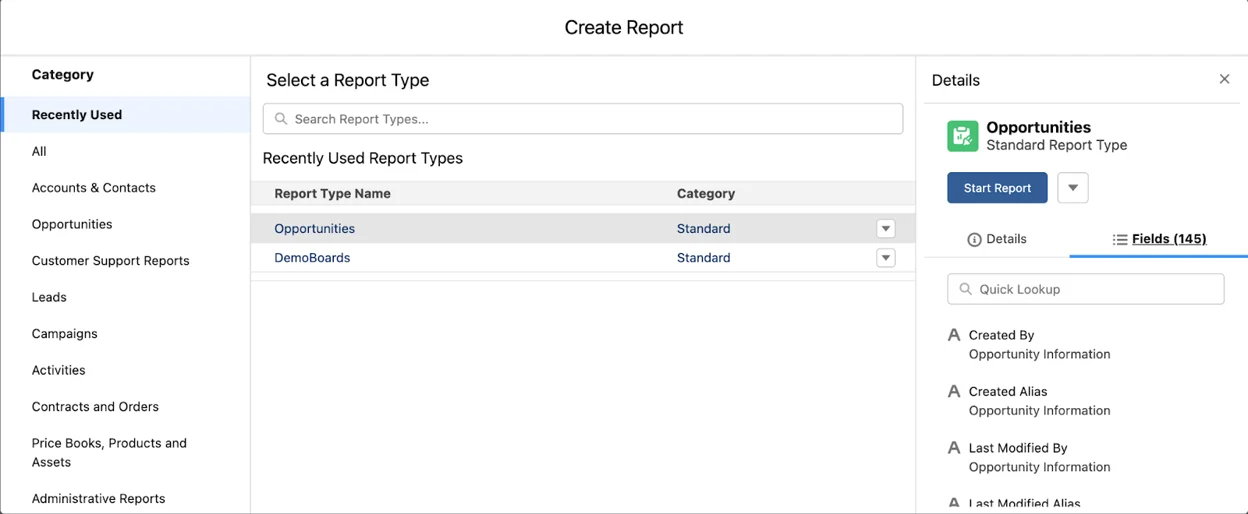 Create Report
2. Make sure your filters are set up to most accurately match your team structure and include only the most relevant records. To see a true aggregate comparison, we recommend changing the Close Date filter range to “All Time”, but you can change this to any time range that will best fit your desired reporting. Here we will also want to change the “Opportunity Status” filter to “Closed Won”.
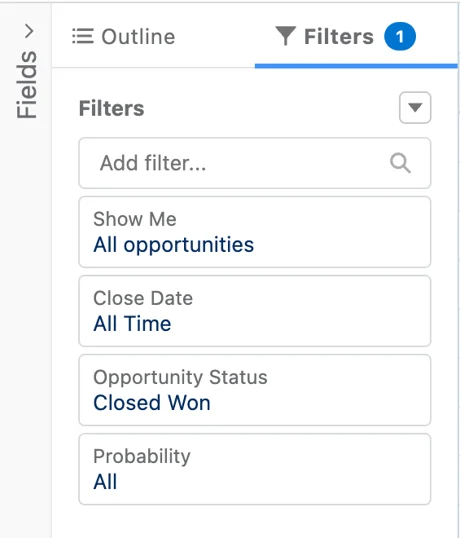 “Opportunity Status” filter to “Closed Won”
3. In the Report Outline section, you can include any information you feel is valuable when comparing our Closed Won Opportunities, but at minimum you will want to include the Opportunity Name, Amount, Age, and Has DemoBoards fields. If you want to dive deeper and compare performance based on client activity with DemoBoards, you may also include Total DB Views, Total DB Shares, Avg DB Views, and Avg DB Shares.
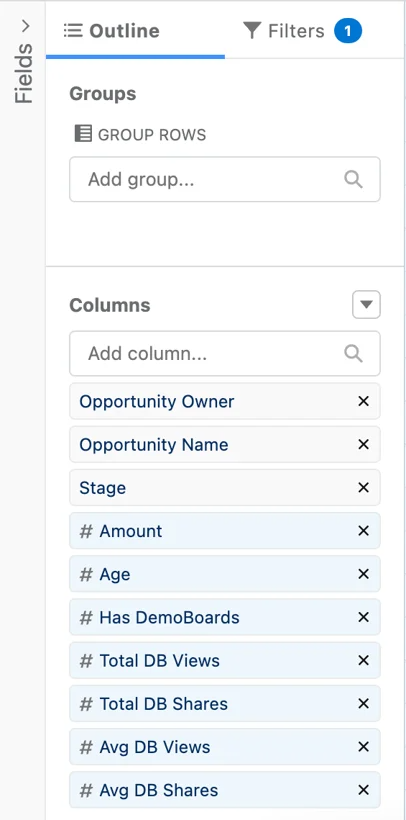 Opportunity Name, Amount, Age, and Has DemoBoards fields.
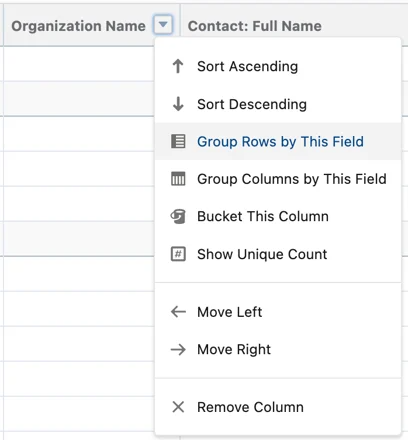
4. Click on the dropdown arrow next to Has DemoBoards and select Group Rows by This Field. You will also want to click on the dropdown arrows next to Amount and Age and choose Summarize Average. You may also choose to Summarize Sum on Amount.
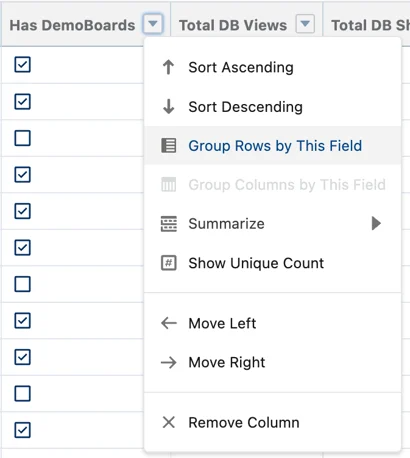 Has DemoBoards and select Group Rows by This Field.
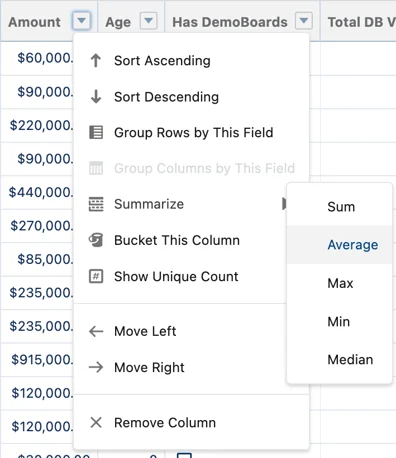 Amount and Age and choose Summarize Average
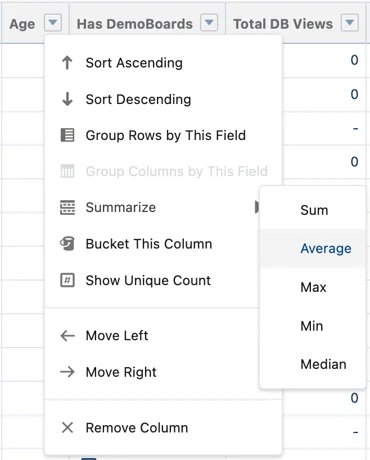 Summarize Sum on Amount
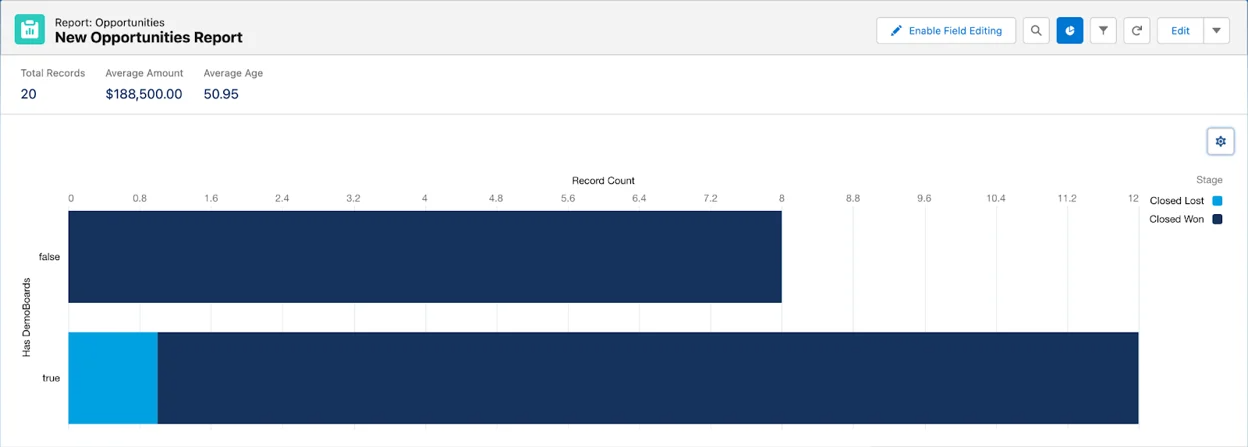
5. Now you’re ready to Save & Run your new report! When this report generates, you will be able to add graphs in order to compare the performance of Closed Won Opportunities with DemoBoards and without DemoBoards.
We recommend utilizing Salesforce’s bar graphs to show the difference in Deal Amounts and Deal Age between Opportunities with and without DemoBoards. You may also use this report to create graphs in a Dashboard.
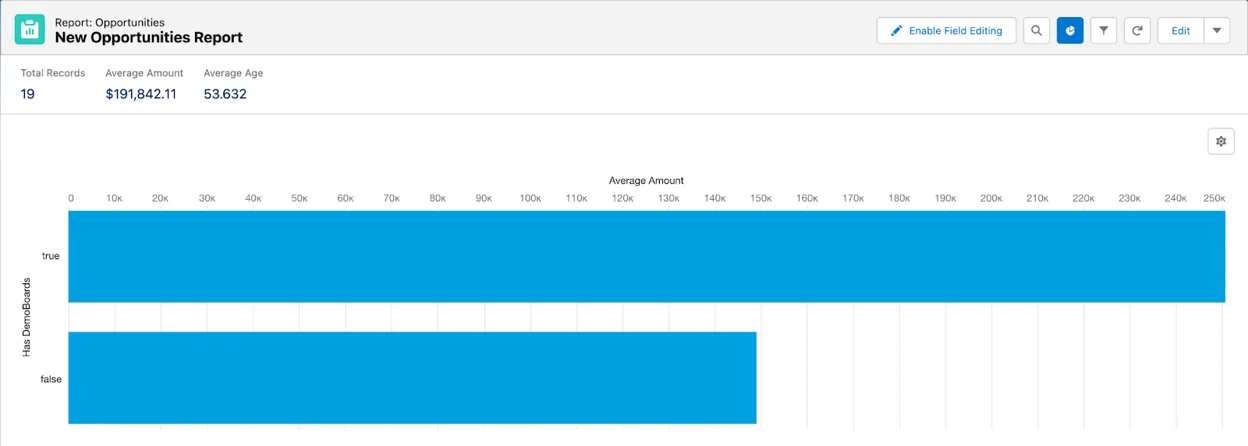 New Opportunities Report
Another great option for Opportunity reports is a simple Closed Opportunity report. This will let us look at all closed opportunities, won or lost, and see if Consensus helps to improve the overall win/loss ratio of your deals.
- In Reports, click “New Report” and choose Opportunities as your Report Type and start your new Report.
 In Reports, click “New Report” and choose Opportunities as your Report Type and start your new Report.
2. Make sure your filters are set up to most accurately match your team structure and include only the most relevant records. To see a true aggregate comparison, we recommend changing the Close Date filter range to “All Time”, but you can change this to any time range that will best fit your desired reporting. Here we will also want to change the “Opportunity Status” filter to “Closed”.
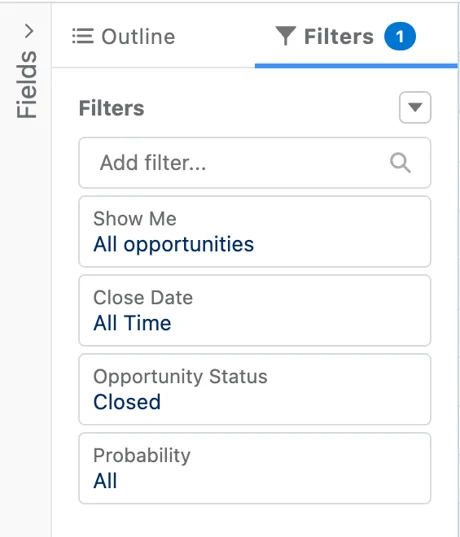 Filters
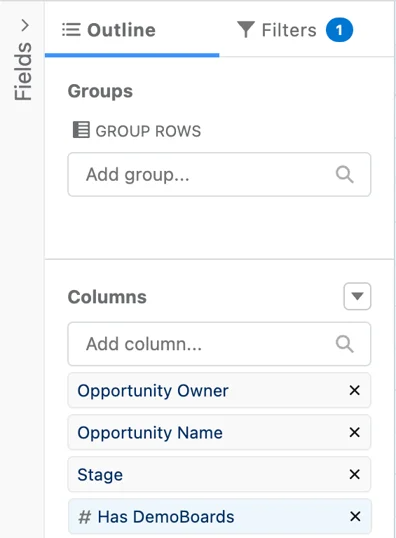
3. In the Report Outline section, you can include any information you feel is valuable when comparing our Closed Won Opportunities, but at minimum want to include the Opportunity Name, Stage, and Has DemoBoards fields. You may find value in including the Amount field as well if you want to see the potential lost value from Closed Lost opportunities.
 Outline
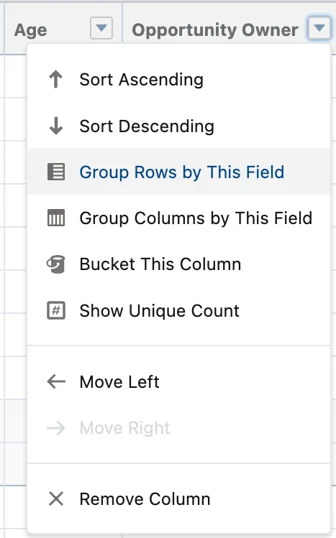
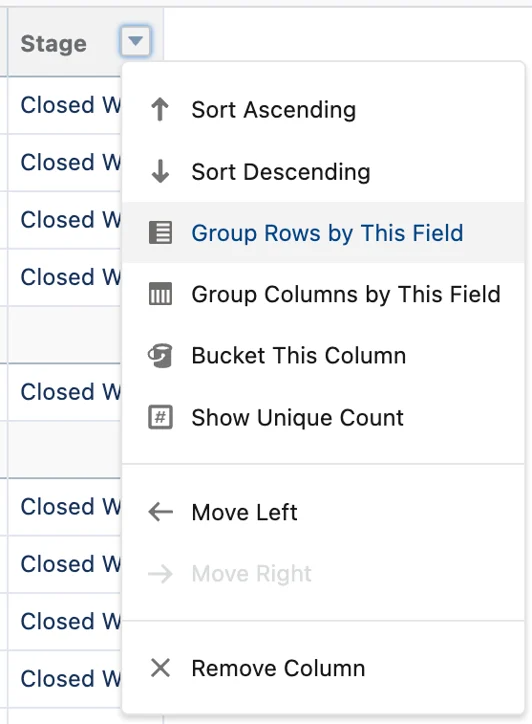
4. Click on the dropdown arrow next to Has DemoBoards and select Group Rows by This Field. Next, Click on the dropdown arrow next to Stage and select Group Rows by This Field. For greater granularity, you may also choose to include the Opportunity Owner field and Group Rows by This Field as well in order to see how DemoBoards impact the performance of individual employees. If you choose to include this field, make sure to group first by Opportunity owner, then by Has DemoBoards, then by Stage.
 Has DemoBoards and select Group Rows by This Field
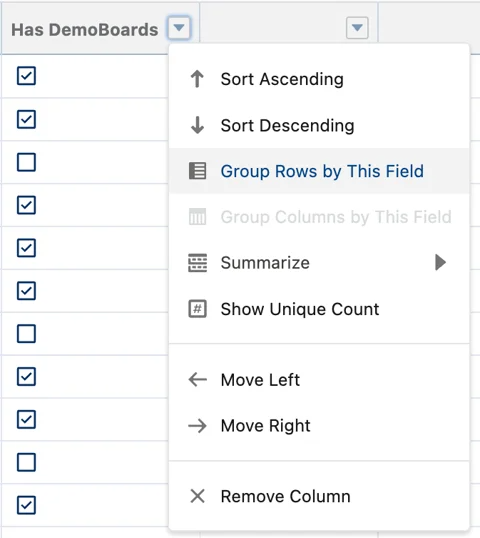 Stage and select Group Rows by This Field
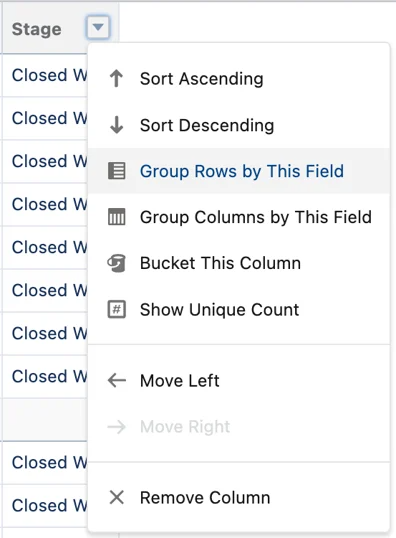 Opportunity Owner field and Group Rows by This Field
5. Now Save & Run your new report.
For this report, we recommend using a stacked bar or stacked column graph. This will help visualize what percentage of deals are won/lost with or without DemoBoards.
 New Opportunities Report
Lead Reports
Another impactful metric to understand is how Consensus affects your company’s Lead conversion rate. More qualified leads with buy-in early in the sales cycle means a much higher chance of closing deals fast and keeping those clients long-term.
To get started, we recommend building a simple All Leads report. In this report, we’re going to include Lead Source and Stage information to show the conversion rate of leads sourced through Consensus vs those sourced elsewhere. Here’s how:
- In Reports, click “New Report” and choose Leads as your Report Type and start your new Report.
 Reports > New Report > Leads (Report Type)
2. In “Filters”, adjust your time frame and your “Show Me” filter to show only the Lead data that is relevant to you, as discussed above. You can use this report to report on metrics across your entire organization or a single team depending on your needs.
3. In the Report Outline section, you can include any information you feel is valuable when comparing our Closed Leads, but at minimum you will want to include the First Name, Last Name, Converted, and Lead Source fields. If you want to further qualify your leads and filter based on how many times they viewed a DemoBoard, you may also include Total Views.
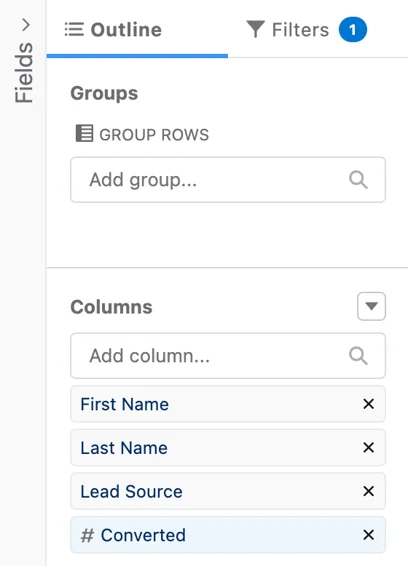 First Name, Last Name, Lead Source
4. Click on the dropdown arrow next to Lead Source and select Group Rows by This Field, and then do the same for Converted.
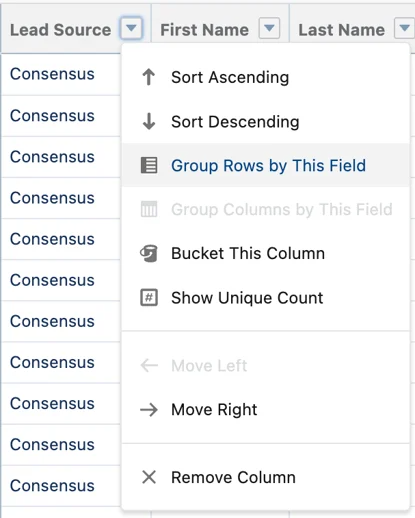 Lead Source and select Group Rows by This Field, and then do the same for Converted.
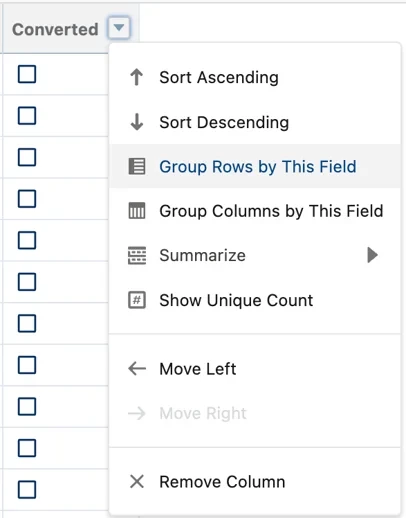
5. Now you’re ready to Save & Run your new report! When this report is generated, you will be able to add graphs in order to compare the performance of Leads sourced from Consensus and those sourced elsewhere.
For this report, we recommend using a Stacked Column or Stacked Row graph to illustrate the conversion rate for our two categories.
Contact Reports
Similar to our Leads report, we can make a Contact source report to understand how Consensus affects your company’s Contact discovery rate. Many companies utilize Leads in different ways, so you may find more value running reports with Contacts instead. Additionally, this report should help show just how many net new Contacts are discovered through Consensus.
To get started, we recommend building a simple All Contacts report. Here’s how:
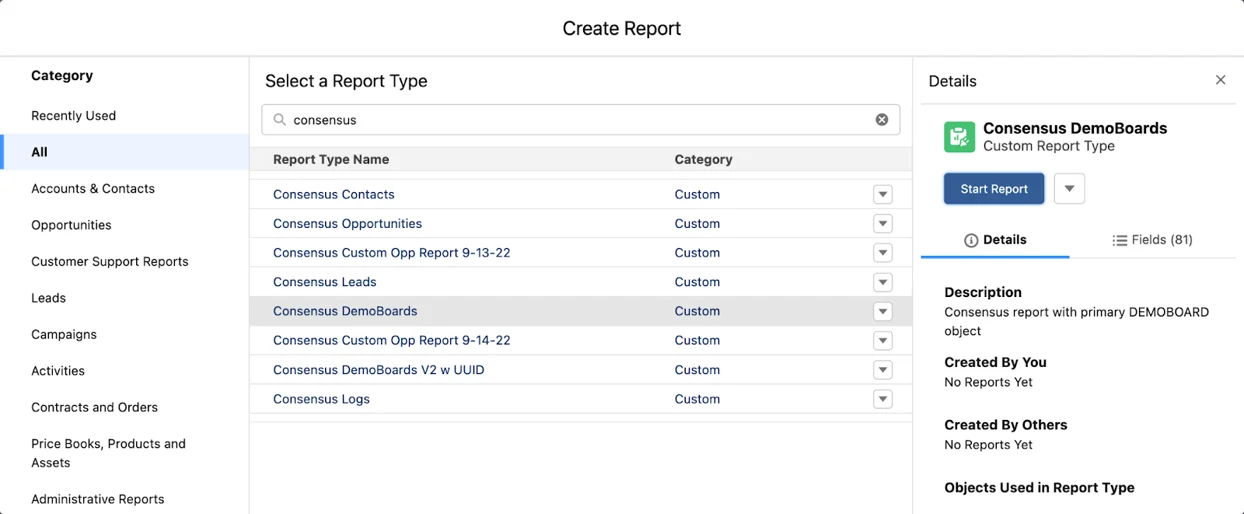
- In Reports, click “New Report” and choose Contacts & Accounts as your Report Type and start your new Report.
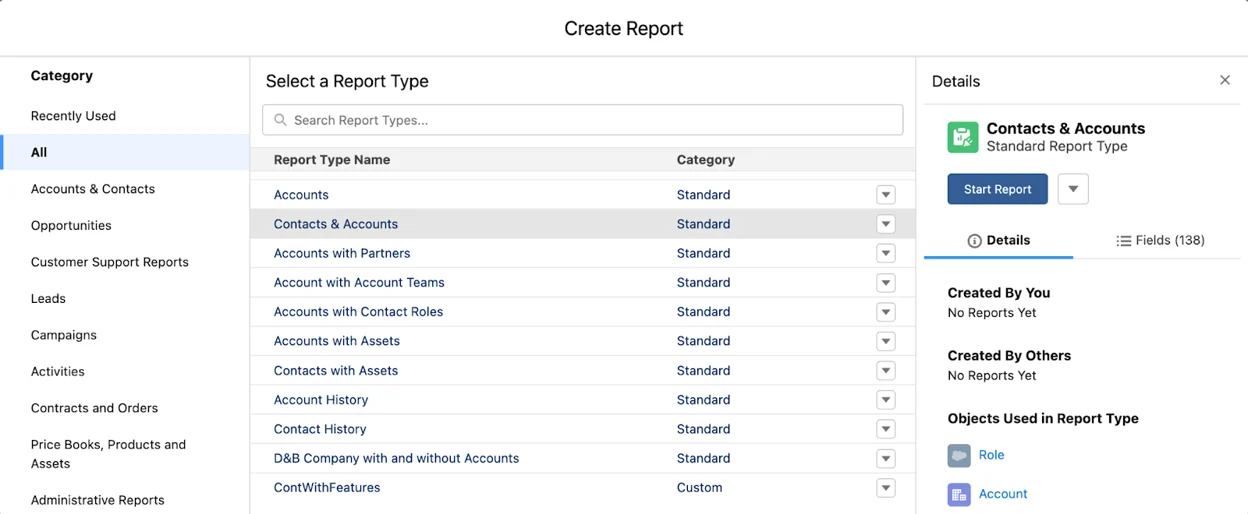 New Report > Choose Contacts & Accounts (Report Type)
2. In “Filters”, adjust your time frame and your “Show Me” filter to show only the Contact data that is relevant to you, as discussed above. You can use this report to report on metrics across your entire organization or a single team depending on your needs.
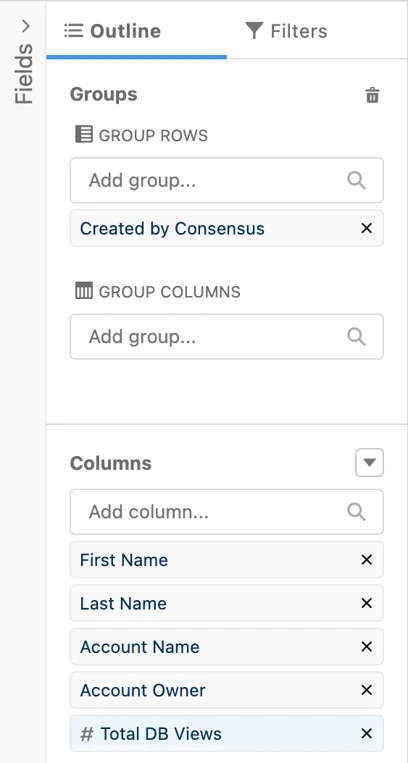
3. In the Report Outline section, you can include any information you feel is valuable when comparing contacts, but at minimum you will want to include the First Name, Last Name, and Created by Consensus fields. If you want to further qualify your contacts and filter based on how many times they viewed a DemoBoard, you may also include Total Views.
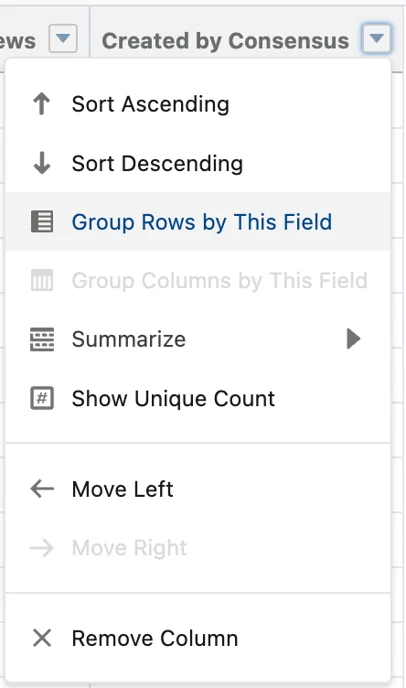
4. Click on the dropdown arrow next to Created by Consensus and select Group Rows by This Field.
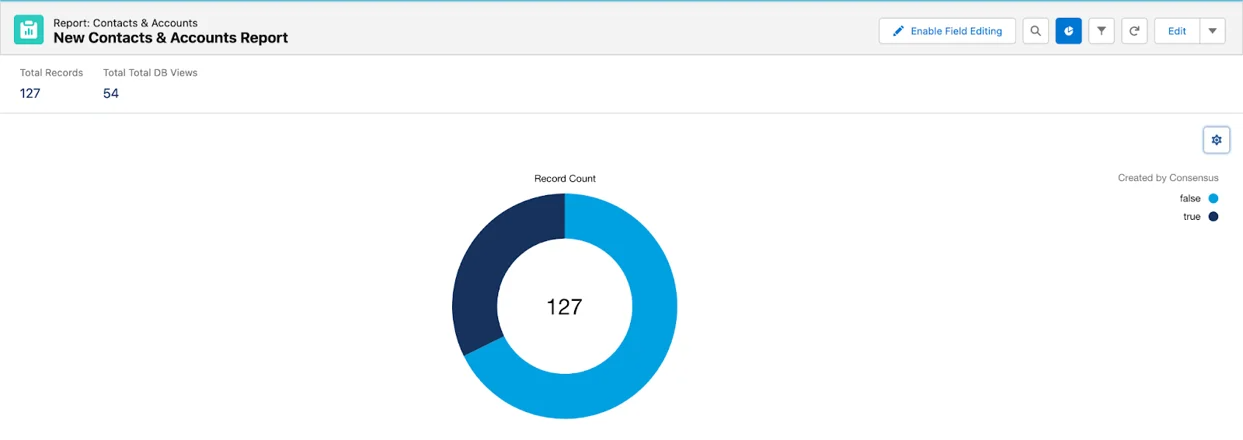
5. Now you’re ready to Save & Run your new report!
For this report, we recommend using a Donut graph to illustrate the percentage of Contacts that have been created by Consensus.
Demo Reports
Now that we’ve discussed value-proofing reports, let’s dive into some reports that can help you improve how you use Demos! Your organization will likely have a well-built library of demos that you use for specific types of clients and at specific points in the sales cycle. But to make sure you are being effective with these demos, A/B testing is a must and may mean the difference when it comes to reaching your sales goals.
To help you start off right, here is a sample report you can create to start running comparisons on your demos:
- In Reports, click “New Report” and choose Consensus DemoBoards as your Report Type and start your new Report.
 Reports > New Report choose Consensus DemoBoards (Report Type)
2. In “Filters”, adjust your time frame and your “Show Me” filter to show only the DemoBoard data that is relevant to you, as discussed above. You can use this report to report on metrics across your entire organization or a single team depending on your needs.
3. In the Report Outline section, you can include any information you feel is valuable when comparing Demos and DemoBoards, but at minimum you will want to include the Demo Name, DemoBoard ID, Organization Name, Contact or Lead Full Name, DemoBoard Opportunity Stage, DemoBoards: Total Invitations, DemoBoards: Total Views, and DemoBoards: Total Shares fields.
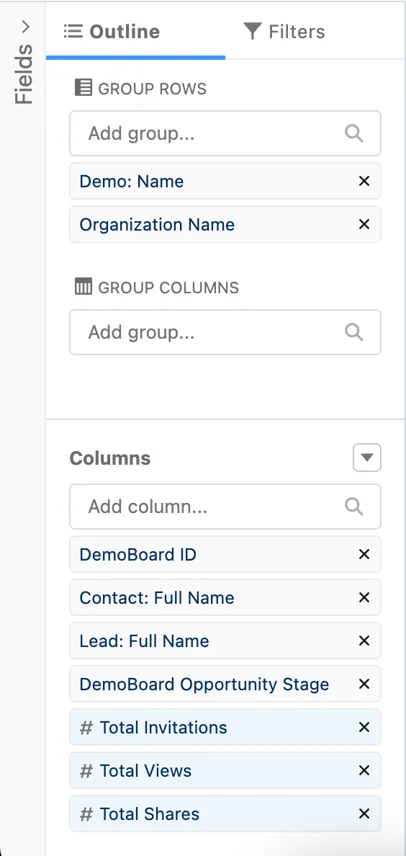 Demo Name, DemoBoard ID, Organization Name, Contact or Lead Full Name, DemoBoard Opportunity Stage, DemoBoards: Total Invitations, DemoBoards: Total Views, and DemoBoards: Total Shares fields.
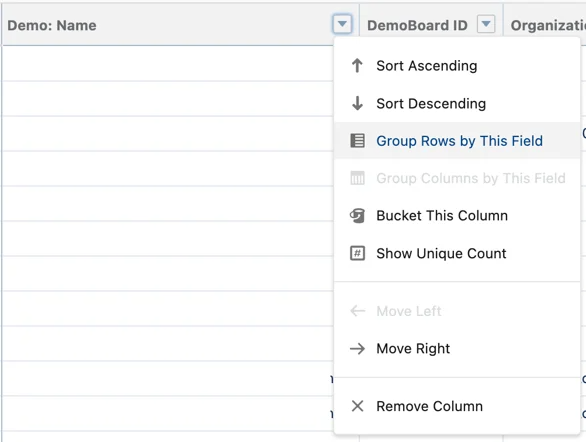
4. Click on the dropdown arrow next to Demo Name and select Group Rows by This Field. Do the same for either the DemoBoard ID or Organization Name field.
5. Now you’re ready to Save & Run your new report!
With this report, you will be able to see the total number of invitations associated with each demo, as well as the total views and shares. These last two metrics are important so you can see how your clients are reacting to demos, not just what is being sent out the most by your team. For even more granularity, you can create a Summarized Average value for each of the metric columns to see on average which demos are the most popular.
If you’d like to create graphs to visualize this data, we recommend a bar or column graph with the x-axis being one of the metric fields provided.
With this data, you can now get a glimpse into your most popular demos and determine what makes them so popular. You can also sort your demos based on what point in the sales cycle they are usually deployed. This type of report can enable you to draw insights that can help you build more effective demos as well as help you know when to send what demos.
Another great report to build to prove the value of each demo is a Consensus Opportunity Report. This report displays only opportunities with DemoBoards, and so we can use this report to see the average deal value of each Demo.
To get started, we recommend building a simple Consensus Opportunity report. Here’s how:
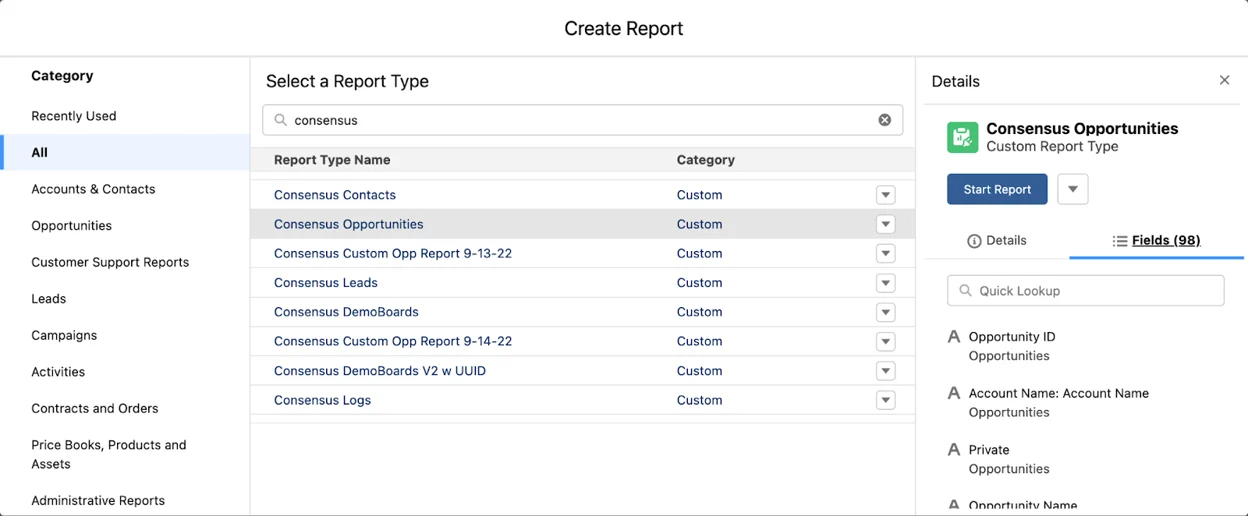
1. In Reports, click “New Report” and choose Consensus Opportunities as your Report Type and start your new Report.
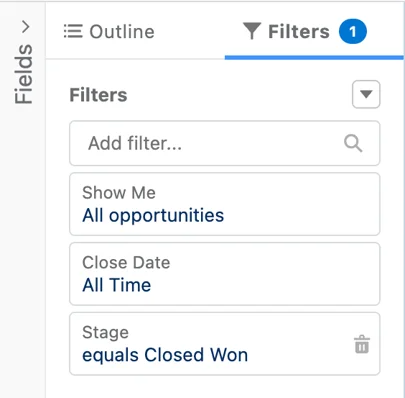
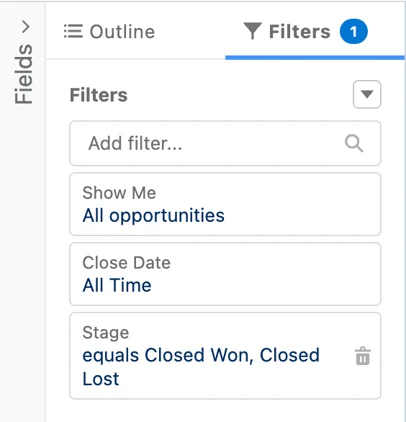
2. In “Filters”, adjust your time frame and your “Show Me” filter to show only the Opportunity data that is relevant to you, as discussed above. You can use this report to report on metrics across your entire organization or a single team depending on your needs. You will also want to include a Date Range Filter and filter either for all opportunities over “all time” or for a time frame that fits your needs, and a Stage filter set to “Closed Won”.
3. In the Report Outline section, you can include any information you feel is valuable when comparing Opportunities or Demos, but at minimum you will want to include the Demo: Name, Opportunity Name, DemoBoard Name or ID, and Amount fields. If you want to further qualify your contacts and filter based on how many times they viewed a DemoBoard, you may also include Total Views.
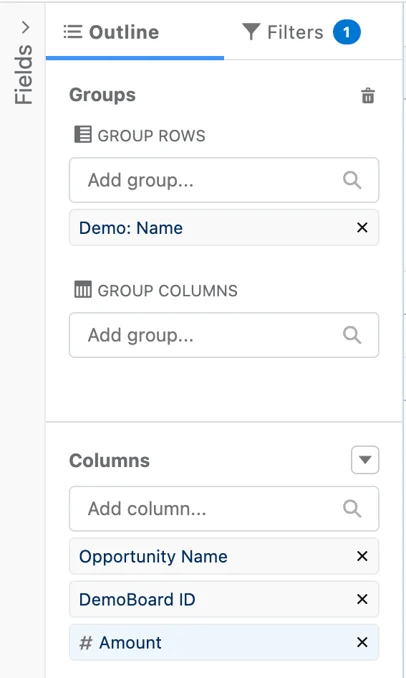
4. Click on the dropdown arrow next to Demo Name and select Group Rows by This Field.
5. Click on the dropdown arrow next to Opportunity Name and click Show Unique Count, and finally click the dropdown arrow for Amount, choose Summarize and click Average.
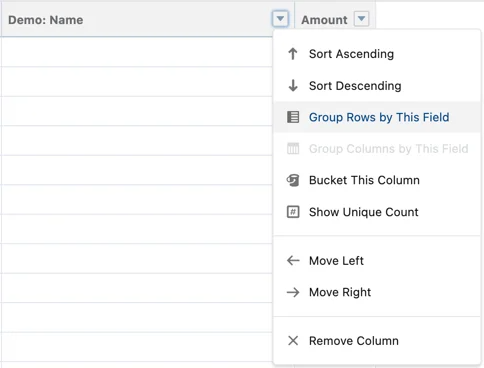 Amount > Summarize > Average
 Show Unique Count
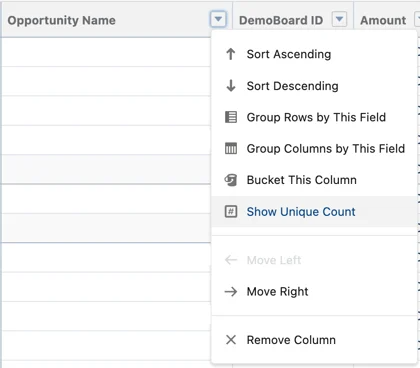
6. Now you’re ready to Save & Run your new report!
In this report, you will now be able to see all of your active demos, what closed won opportunities they have been used on, and the average amount for each opportunity, this should help you make some assumptions as to which demos are yielding the most value.
If you want to get even more granular with this report, you can include the following:
- In Filters, instead of choosing Closed Won as your Stage filter, choose Closed Won and Closed Lost.
2. In Outline, Add the Stage field, click the dropdown arrow, and select Group Rows by This Field.
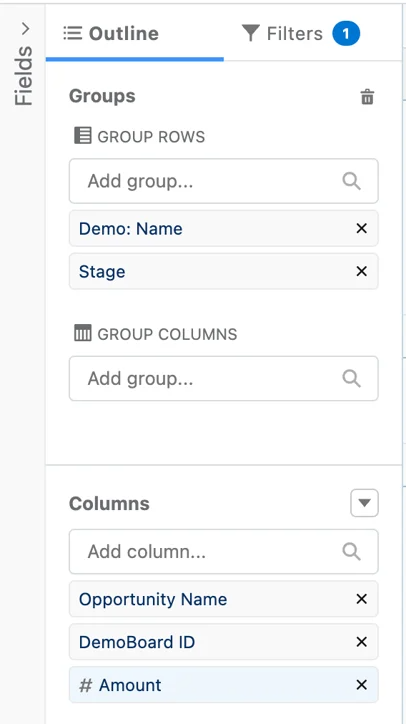
Now, you will be able to see the average and total deal amounts that are won with Demos and the average and total deal amounts that are lost with Demos.