In this article we will review the different CSV Reports you can download from within your Consensus Account
While Consensus strives to give you a powerful view into your data and analytics, we understand that you may need to export this data in order to combine it with data from other tools or create unique views that help you understand how effective Consensus is for your teams. In order to do this, Consensus offers several different CSV Reports where you can download the data from your Account in order to generate the unique views you need.
Summary Demolytics
Summary Demolytics give you an aggregate view of both Sales and Marketing views for your demos, so these reports will contain views from both sides.

Branching Report
- This report gives you the number of responses give for each answer for each of the Advanced Branching Demos selected within your filters.
Features Report
- This report shows how many times a feature was selected for each of the demos you have selected within your filters.
Sales Demolytics
You can find reports for each of the tables available within Sales Demolytics. This helps ensure you can export the data you need.
Enhanced Reporting for Multi-Demo Support
We've updated the Sales Demolytics and Reseller Sales Demolytics pages to provide more detailed information about demo usage. Now, you can:
- See the number of demos added to each demo board: A new column titled "Demos Added" will display this information.
- Download reports with this data: You can download reports in CSV format and view the "Demos Added" column alongside other relevant metrics.
Group Report

- This allows you to download the table data exactly as it shows within the Groups table.
- Note* You can update which Groups show within the table using the Primary Filters at the top of the Sales Demolytics page.

- Note* You can update which Groups show within the table using the Primary Filters at the top of the Sales Demolytics page.
Users Reports
- Basic Users Report - This allows you to download the table data exactly as it shows within the Groups table.
- Detailed Users Report - This report breaks down each User by the Demos they use to created DemoBoards. This allows you to see what Demos each of your Reps are using and how effective they are.

Organization Reports
- Basic Organization Report - This allows you to download the table data exactly as it shows within the Groups table.
- Detailed Organization Report - This report breaks down each Organization by View so you can see who within the Organization has engaged with the DemoBoards.

Demo Report (Sales)

- This allows you to download the table data exactly as it shows within the Demos table.
Marketing Demolytics
Leads Report

- This allows you to export your leads to easily add them to your Marketing Automation Tool or us the Lead data to generate reports. This report will include Lead Collection Form data along with View Stats such as Personalization Responses and View Time.
Demo Report (Marketing)

- This allows you to download the table data exactly as it shows within the Demos table.
Manage Users
Manage Users Report

- This allows you to download the table data exactly as it shows within the Demos table.
Troubleshooting
My data isn't lining up to the column headers. What do I do!?
- While we strive to help ensure your data shows properly, your spreadsheet tool may have different defaults or you may have system defaults that bring in the data in a way that adjusts the data incorrectly. This is fairly common with Microsoft Excel. Follow the steps below to ensure the data is opened properly:
- Open Microsoft Excel on your device
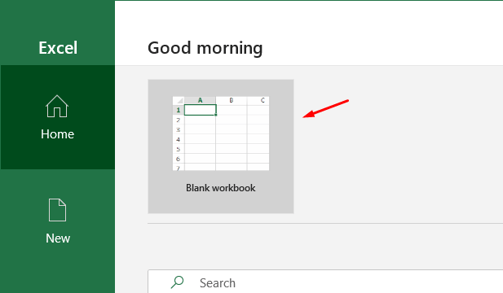
- Select 'Blank workbook'

- Open 'Data' tab
- Click 'From Text/CSV'

- Select the downloaded Organization report on your device
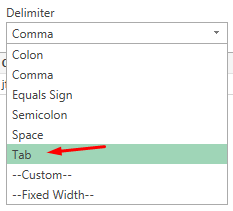
- Within the opened document preview page, set the Delimiter as 'Tab'

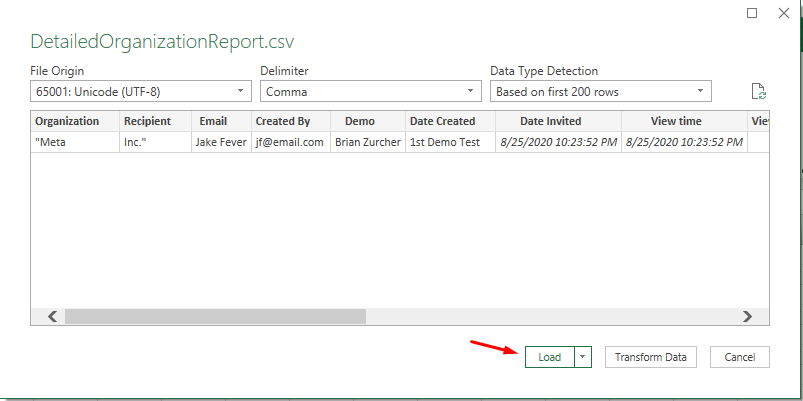
- Click 'Load' on the opened screen

That's it! Your data should load and show as expected within your tool.
