The Public version of your demos can easily be placed on your website or other web properties to help drive education and lead generation for your solutions. Marketing Demoltyics allow you to understand the overall performance of you Public demos and understand which demos are performing best. This allows you to see data across the board for all demos or easily compare demos to understand how to continue to enhance your demos.
You can find the Marketing Demolytics either under the Demolytics or Public Links (both of these lead to the same page). By default, we will show you the Public Link Demolytics for all of your demos.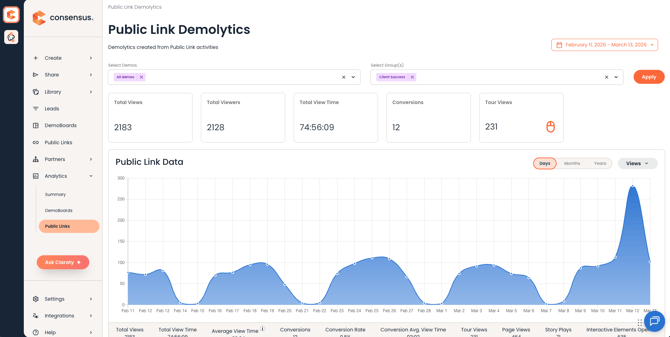
Within the Public Link Demolytics, you can filter your stats to get the exact view you need:
- Group - This allows you to view the stats for demos that were grabbed by a specific Group. So if you have multiple Groups with access to the same Demo you can review the stats of how that demo has performed for a specific Group.
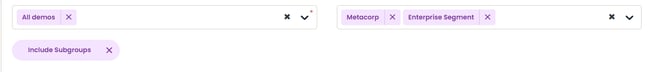
- This is based on the Group of the User that obtained the Public Link
- The Include Subgroups option will automatically include the stats for any Public Demos obtained by Users within Subgroups of the Group selected.
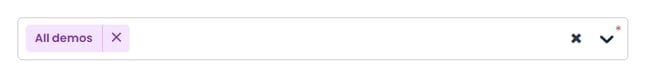
- Demo - This allows you to narrow your view by a specific Demo or Demos. You can use this to view the Demos for a specific product or Use Case as well as to compare the stats of Demos you are using for A/B testing.
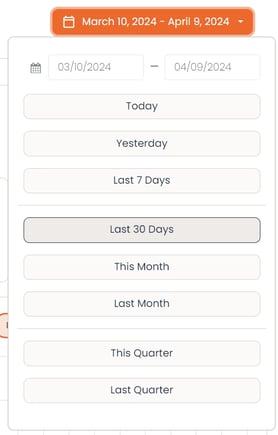
- Date Range - this allows you to set the specific time frame represented within the stats.
- Once you have your filters set, simply select Apply to reset the data based on your filters.
Now lets' take a look at what stats are available for your Public Links:
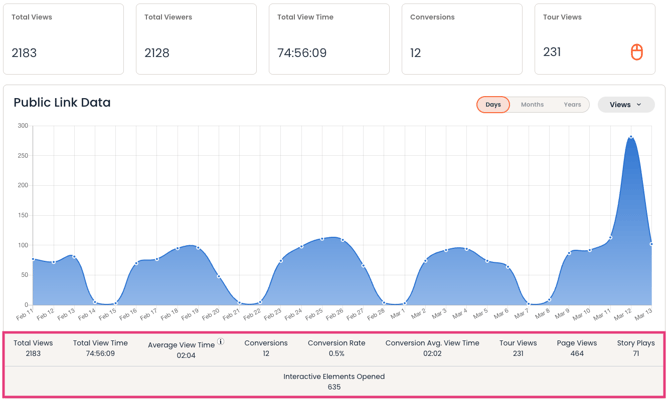
- Total Views - This represents the total number of views for the demos selected in your filters
- What Counts as a View? - A view is a unique instance in which a viewer interacts with one of your demos
- I.E. Viewing an Advanced Demo with an Intro Video that leads to a Standard Demo with several features counts as 1 view.
- What Counts as a View? - A view is a unique instance in which a viewer interacts with one of your demos
- Total View Time - This represents the total video view time for those views.
- Average View Time - The total video view time divided by the Total Views
- Conversions - This represents the amount of times viewers have submitted the Lead Collection form whether activated by the Lead Gate or by selecting a Call to Action tied to the Lead Collection form.
- Conversion Rate - This is the number of Conversions divided by Total Views
- Conversion Average View Time - This is the Average View Time for those Viewers that have submitted the Lead Collection form
This information helps to give a high level view of how well the Public Link of your Demos are performing. Underneath this graph is the table of how each selected Demo within your filters has performed. This allows you to understand which Demos are performing the best and easily compare Demos you are using for A/B testing (which we always recommend)
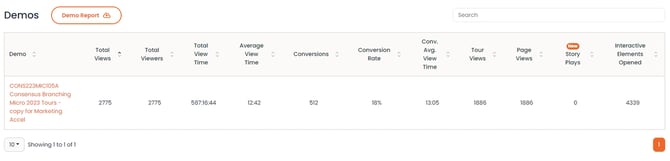
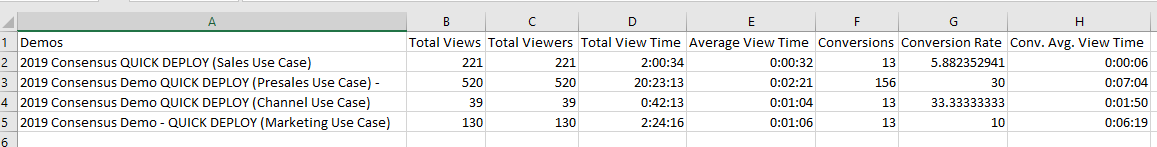
The graph contains all of the same data points available within the top graph, and also allows you to export these stats so you can use them within your own Analytics or BI tools in connection with any other Marketing efforts. You can find this report right at the top of the Demos table.
- select 'Download Report' and Consensus will download the CSV Report to your device.
Consensus Marketing Demolytics helps to give you the data and insights you need to make decisions on how to continually enhance how well your Demos perform along with insights into how you can enhance your general Marketing approach.