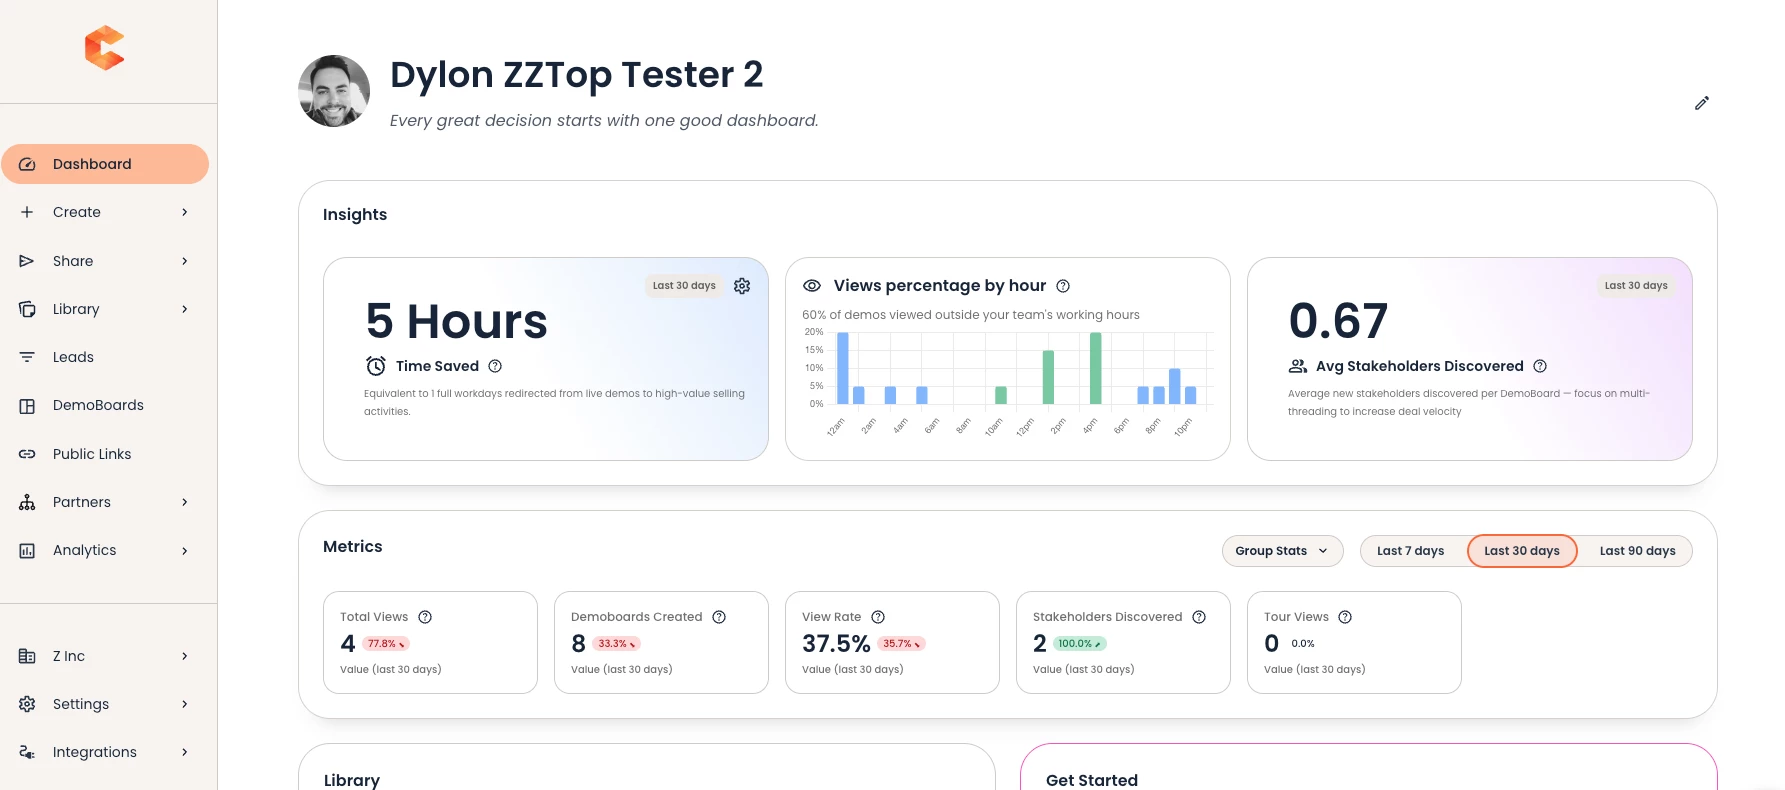
The Consensus Dashboard is your new homepage experience, providing immediate visibility into demoboard performance, content engagement, and key activities like sharing new content. Instead of landing on a static page with our onboarding video, you'll now see key metrics and have quick access to your demo library to share content every time you log in.
What You'll See
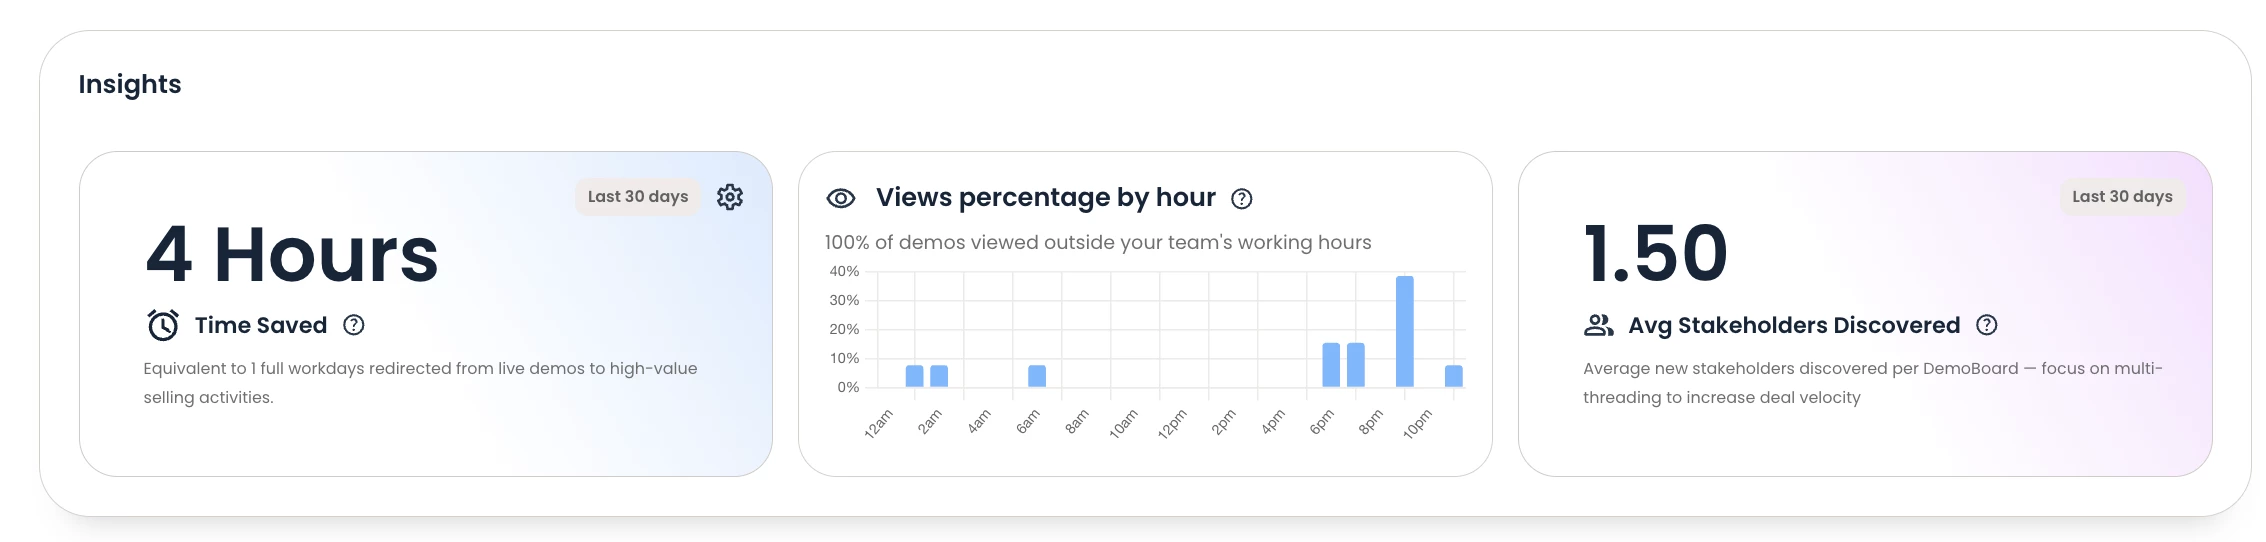
Insights
We are introducing a few widgets that help tell a story about Consensus usage. This Insights area is a place for widgets that are focused more on telling the soft ROI story of using the platform. Think ‘efficiencies’ more than hard number-based ROI.
Time Saved:
A calculator that looks at total time saved (hours) by delivering demos with Consensus.
-
Calculation: demoboards created * time saved / 60.
The calculator settings for avg. live demo time and time it takes to create a demoboard can be adjusted for by each user as they need.
Views Percentage by Hour:
A widget showing demo views across the hours of a typical work day (9am-5pm) within the users day.
Avg. Stakeholders Discovered:
A widget showing the average number of stakeholders discovered per viewed demoboard.
-
Calculation: (stakeholders / viewed)
Metrics (Last 7, 30 or 90 Days): The top of your dashboard displays six key performance indicators:
- Total Views: The number of times your demos or Demoboards were viewed
- Demoboards Created: New Demoboards you've built in the time period
- Demos Added: Number of demos you are adding to demoboards
- View Rate: The percentage of recipients invited to demoboards that resulted in actual views (engagement quality)
- Stakeholders Discovered: New contacts identified through sharing demos
- Tour Views: Tours that were viewed
Each metric shows a trend indicator (↑ or ↓) comparing the current 7,30,or 90-day period to the previous period:
- Green arrow up (↑): Positive trend - your metric increased
- Red arrow down (↓): Declining trend - your metric decreased
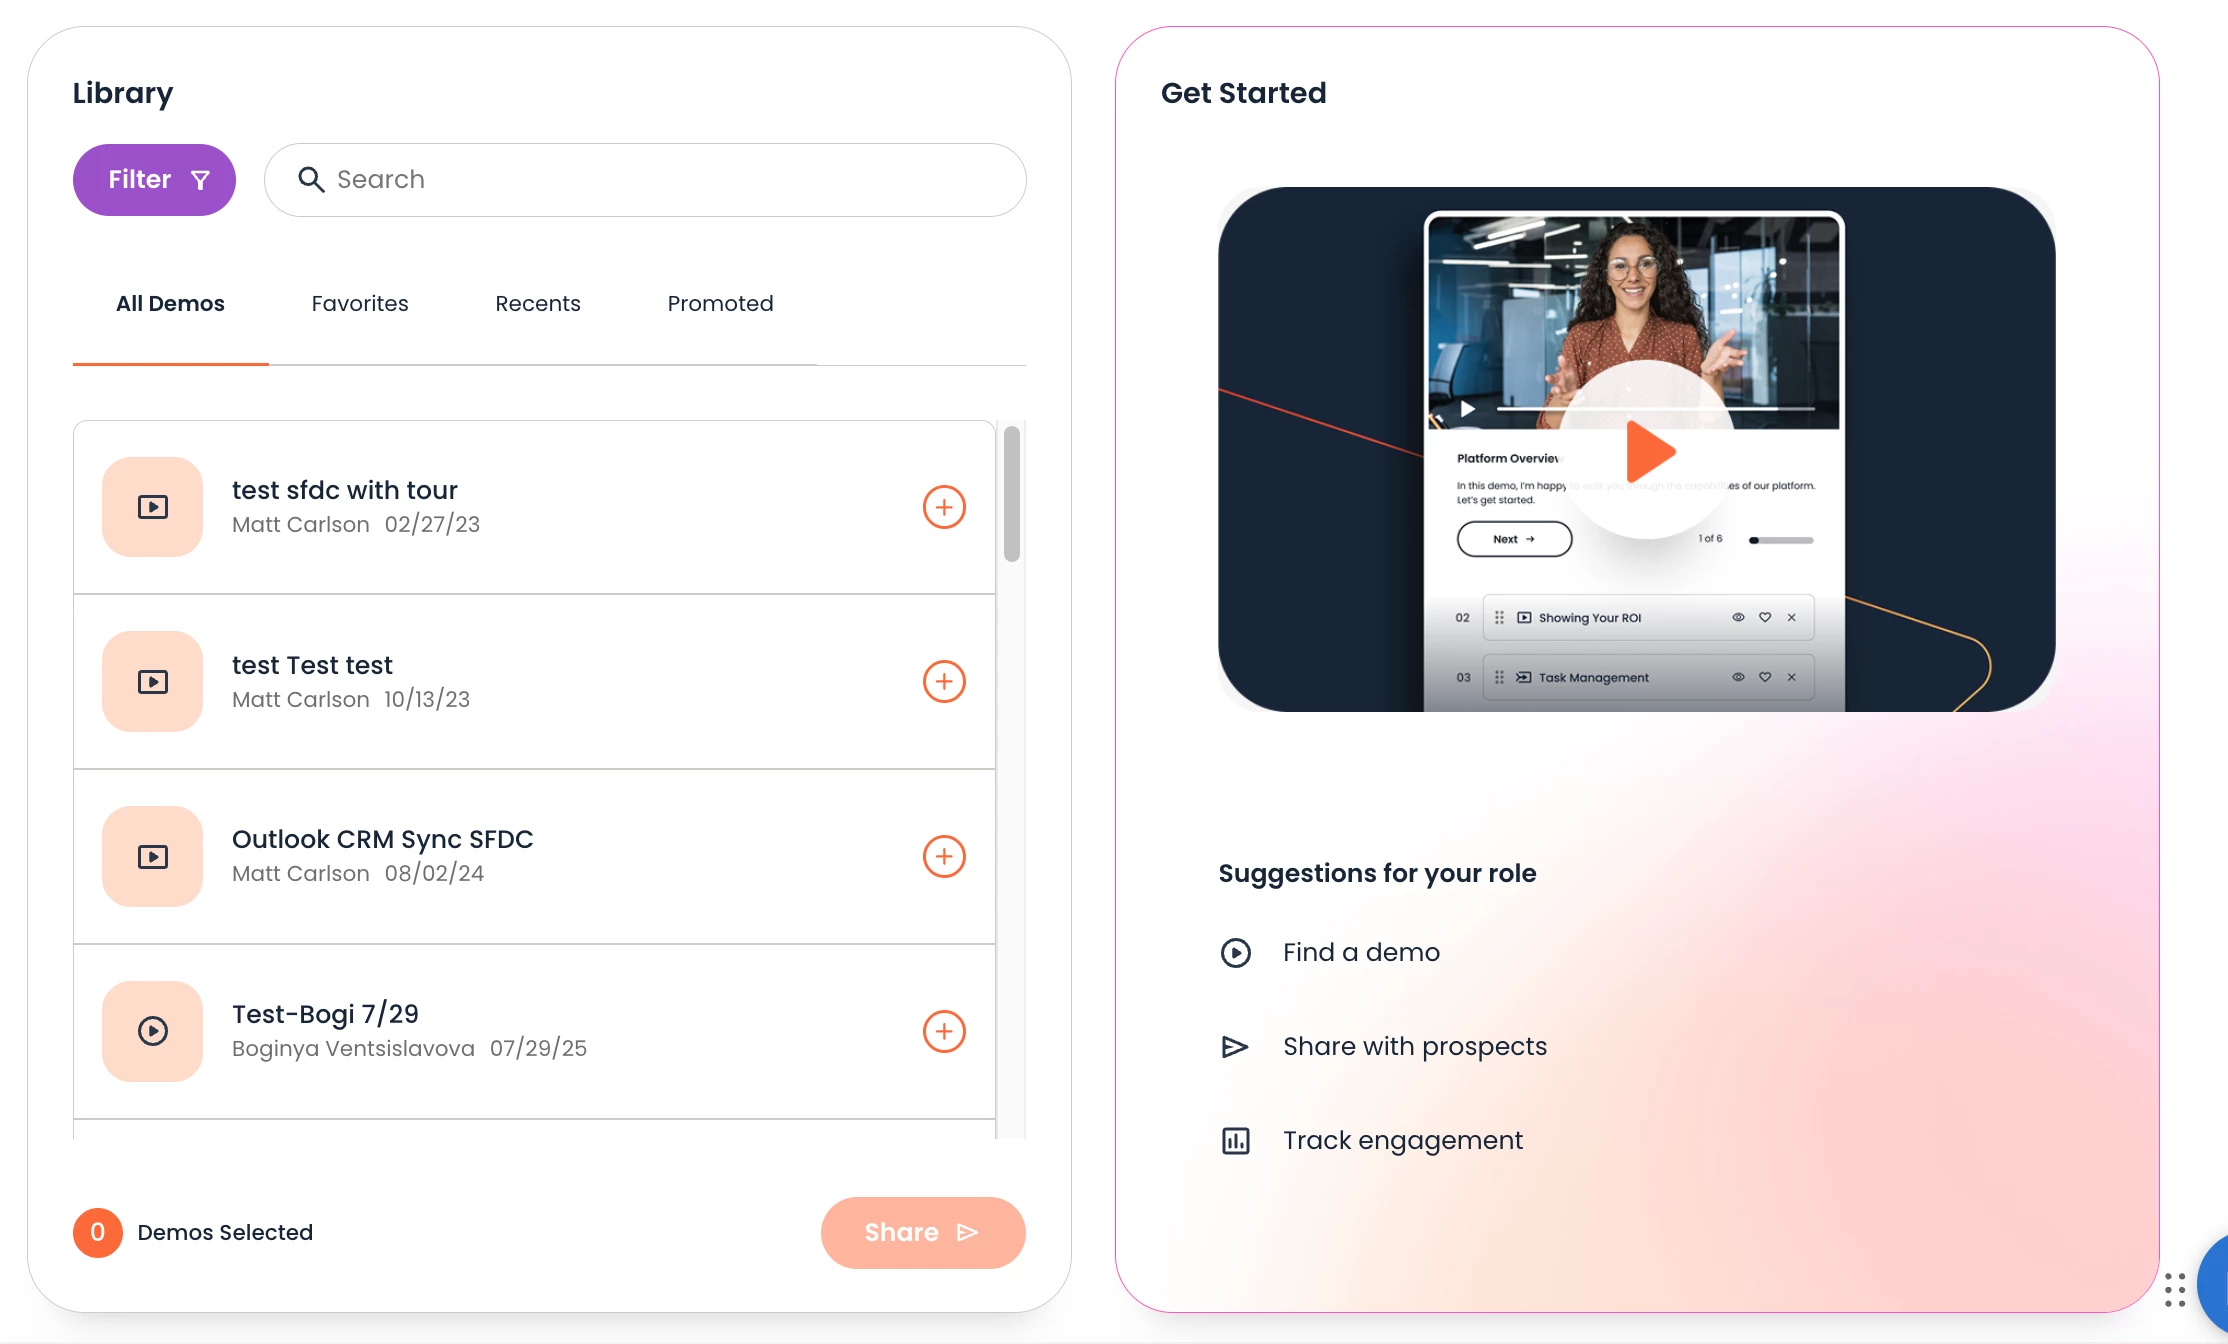
Library Section: Below the metrics, you'll find quick access to your demo library with four tabs:
- All Demos: Complete list of available demos
- Favorites: Demos you've marked as favorites for quick access
- Recents: Demos you've recently viewed or worked with
- Promoted: High-value content recommended by your team or admins
Get Started Resources: New to Consensus? The right side of your dashboard includes our featured walkthrough video to help you get started quickly.
Toggling Between Views
My Metrics vs. Group Metrics: At the top of the dashboard, you can toggle between two views:
- My Metrics (default): Shows your individual performance data
- Group Metrics: Shows aggregated data for your entire team/group
Use the Group Metrics view to:
- Benchmark your performance against team averages
- Identify team-wide trends
- Understand collective impact
Simply click the toggle button to switch between views.
Understanding Your Metrics
Total Views: This counts every time someone views demos you’ve sent. A high number indicates strong content distribution. Track the trend to see if engagement is growing.
View Rate: This is your engagement quality metric. A view rate above 75% is excellent. If your view rate is declining, it may indicate:
- You're sharing with less-engaged audiences
- Your targeting needs refinement
- Content relevance needs improvement
Stakeholders Discovered: This measures buying group expansion - how many new people are being introduced to your demos through sharing. Growing stakeholder discovery means you're effectively multi-threading within accounts.
Trend Indicators: Pay attention to directional trends, not just absolute numbers:
- Consistent upward trends indicate improving effectiveness
- Downward trends may signal need for strategy adjustment or new content
Using the Dashboard in Your Workflow
Daily Check-ins: Start your day by checking your dashboard to:
- See if your demoboards are gaining traction.
Weekly Reviews: Use the dashboard weekly to:
- Compare your View Rate to team benchmarks (Group Metrics toggle)
- Track whether your Demoboard creation is keeping pace with sales activity
- Celebrate wins (increased Stakeholder Discovery, high View Rates)
Monthly Analysis: At month end, screenshot your metrics to:
- Document Consensus impact in your territory
- Share success stories with your manager
- Help Prove ROI for internal stakeholders from your individual or team performance.
FAQs
Q: Can I change which metrics display?
A: Yes. More customization is coming in a future release, but you can select the “edit” pencil in the top right of the dashboard to toggle on/off what sections or widgets you want displayed.
Q: Can I see data for longer than 90 days?
A: Currently, the dashboard shows only options for 7,30 or 90 day periods/trends.
Q: Why did my View Rate go down even though my Total Views went up?
A: View Rate is percentage-based. If you shared with more people but fewer of them viewed your content, your view rate decreases even though absolute views increased. This suggests you may need to refine your targeting.
Q: What's considered a "good" metric?
A: Benchmarks vary by industry and sales cycle, but generally:
- View Rate above 70% is strong
- Stakeholder Discovery growing month-over-month is positive
- Demoboard creation aligning with opportunity volume is healthy
Compare against your team using Group Metrics to see how you stack up.
Q: Can I export this data?
A: Currently, you can screenshot the dashboard for sharing. Export capabilities are planned for a future release.
Q: I'm not seeing any data - why is my dashboard empty?
A: If you're brand new to Consensus or haven't created demos yet, your metrics will show zero. Start by creating your first demo and sharing it to begin tracking engagement.
Q: Where did the "Get Started" video go?
A: The video is still available in the "Get Started" section on the bottom, right side of your dashboard. You can also access the full Consensus Academy from the Help menu.
Coming Soon
This is Phase 1 of the Consensus Dashboard. Here's what's coming next:
- Customizable layouts and templates: Add, remove, and rearrange widgets
- Role-specific metrics: Specialized dashboards for Marketing, Admin, Pre-Sales, and Manager roles
- Onboarding Guides: Guided action paths for new users
- Export capabilities: Download your data for reporting
- ROI-Focused Widgets
- CRM integration: See Consensus data alongside your CRM Data
- Insights and Recommendations: Activity feeds, and more recommendations for actions that each user should take to get the most out of Consensus.
Need Help?
If you have questions about interpreting your metrics or suggestions for improving the dashboard, please contact support@goconsensus.com or click the feedback button in the lower right corner of your dashboard.