Read viewer heatmaps
Heatmaps show you what a specific viewer actually watched — second by second — versus what they skipped, rewatched, or paused on. It's the most granular Demolytics signal Consensus produces, and it tells you exactly which parts of the demo the prospect engaged with.
Where to find them
Analytics → DemoBoards Demolytics → click into a specific DemoBoard → click into a specific viewer. The heatmap is in the per-viewer detail view.
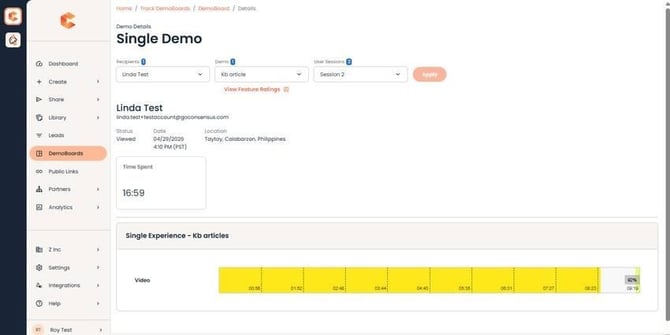
Per-viewer heatmap — the colored bar shows watch behavior across the demo timeline.
Reading the heatmap
- Green sections — the viewer watched this normally.
- Red / orange sections — the viewer rewatched these — they hit pause, scrubbed back, replayed. Strong signal that this section is important to them.
- Grey / missing sections — the viewer skipped these. Either they fast-forwarded or didn't reach this point in the demo.
How to use heatmaps in sales
- Open the heatmap before your next call with the prospect. The rewatched sections are where they had questions or doubts — address those explicitly.
- Skipped sections are also signal — they may indicate the prospect cares less about that capability.
- For Standard Personalization Demos, pair the heatmap with the viewer's feature ratings (Very/Somewhat/Not Important) for a complete picture.
Personal Intro Video viewing
PIV view time is tracked separately from the demo heatmap. Each viewer has its own PIV heatmap if they engaged with the Personal Intro Video.