Demolytics Video Data
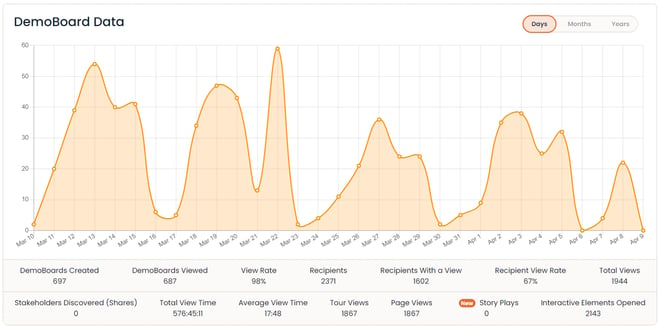
DemoBoards Created - Unique DemoBoard links created.
- Target KPI
-
- 75-100 created per month for Development Teams
- 20 - 40 Per Month for Closing Teams
-
DemoBoards Viewed - The number of DemoBoard links that have been viewed.
View Rate - Percentage of DemoBoards created that have a view. View rates are typically higher for Closing teams than Development teams as Closing teams are working with opportunities that have already shown interest
- Target KPI
-
- Development Teams 10 - 25%
- Closing Teams 30-40 %
-
Recipients - Total number of recipients added to DemoBoard Invite.
Recipients With a View - The number of recipients who have viewed a demo.
Recipient View Rate - Percentage of total recipients that have viewed demo.
Views - Total views of the demo
Stakeholders Discovered (Shares) - When a DemoBoard recipient shares the demo (categorized into 3 different methods)
Shared by viewers - Total Demos shared via 'Invite Others' inside the Demoplayer
Shared by self-registered - Total number of viewers who self-registered via the
"I'm New Here" option on the Who Are You (WAY) page


Shares by users - Total number of additional recipients added by the sender after a DemoBoard link has been created.


View Time - The total amount of time spent by prospects watching your demos.
Average Time - The average amount of time spent per session viewing a demo. Target KPI of 3-4 minutes.
Discover Rate - The discover rate is the percentage of Stakeholders Discovered divided by how many Demoboards Viewed. So 10% Discover rate would mean that for every 10 DemoBoards viewed, 1 New Stakeholder is Discovered.
Doc Downloads - This is for demos where a document has been attached and this number will give a general idea of how many times those documents were clicked and opened.
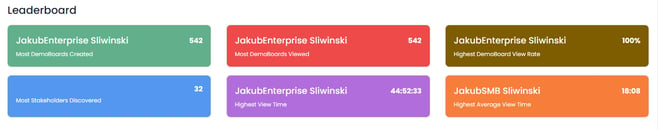
The leaderboard will show the leaders in each of the categories for the DemoBoards they have sent out. For example, in this picture we can see that for DemoBoards Garrett has sent out, his have been viewed the most. Or on the DemoBoards sent out by Jami, her prospects are viewing the demos for the highest average amount of time.
Demolytics Tours Data
- Tour Views - Engagement | counts of Tours (even if one element is opened)

- Page Views - Determine the number of screenshots the viewer visited throughout the tour experience (not unique).
-
The ‘Page Views’ is only displayed when multi screen is enabled.
-

- Story Plays - If a user clicks at least one element within the story flow, it counts as a Play. If the same user leaves the session and returns, it's considered a new story play. However, if the user stays within the same tour session without leaving (clicking back and forth between the story elements), it will be counted as just one Play.

- Interactive Element Opened - This metric is the total number of element(s) are opened, regardless of whether they are part of the story path or not.

Multi-Demo Support
- You can now attach multiple demos to a single demo board.
- The "Demos" column displays the number of demos attached to each board.
- Clicking on the demo count takes you to a page listing all attached demos.
- You can track view time, shares, and feature ratings for each individual demo within a demo board.
- This feature allows for a more comprehensive analysis of prospect engagement and helps you optimize your demo strategies.