
Every time a buyer opens one of your tours, they’re telling you something — what interests them, where they lean in, and when they’re ready for a conversation. Here’s where those signals live and how to read them. Your tour analytics live in two places: Consensus Demolytics for how buyers engage with tours you’ve sent in demos and DemoBoards, and the tour analytics dashboard — which currently lives in the tour builder portal rather than the Consensus app — for how a tour performs overall, across all sessions.
| Part 1: Demolytics — Your Buyer-by-Buyer View |
When a tour is part of a demo, its engagement shows up where you already track everything else:
1. Go to DemoBoards → Track DemoBoards.
2. Hover over any DemoBoard row and click its Analytics icon (or open the DemoBoard) to reach the demo overview.
3. Pick the recipient — and, if they viewed more than once, select the session you would like to view.
For each viewer you’ll see four tiles:
- Total Tour Views — who’s showing up
- Total Tour Duration — who’s leaning in
- Total Tour Steps Completed — how far they went, shown as completed/total (e.g., 19/41)
- Total Video Duration — the demo’s video content, tracked separately from tour time
The Engagement Insights and Heatmaps & Reactions tabs break the session down further. Together, these tell you which stakeholders are self-qualifying and where attention drops — so your follow-up lands at the right moment, about the right thing.
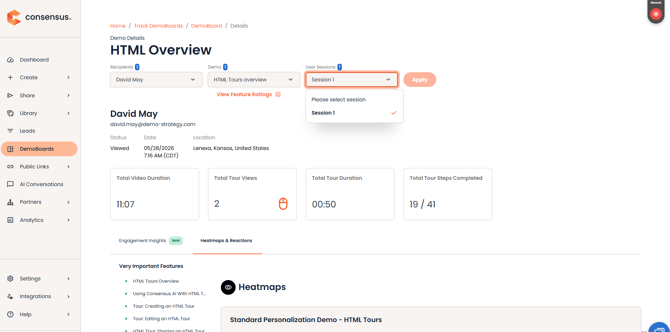
The opening page will show Total Tour Views, Total Tour Duration, Total Tour Steps Completed, and Total Video Duration.
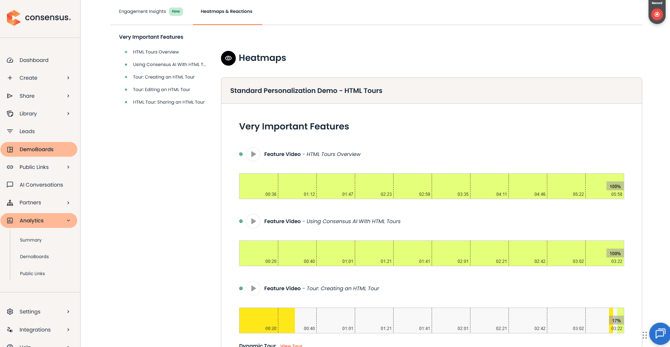
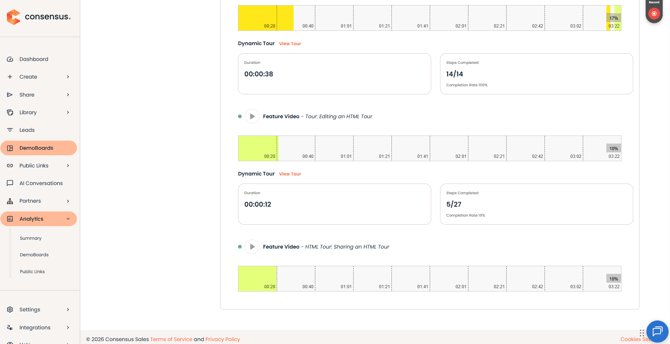
Heatmap page with tour stats
| Part 2: The Tour Analytics Dashboard — Your Big Picture |
For aggregate performance across every session (not just demo sends), open Analytics from the Dynamic Tours section. Before you dig in: data refreshes hourly, on the hour. Set your start date in the past — the dashboard defaults to today, so your first visit will look empty until you widen it; try starting with the last 30 or 90 days for a meaningful first look. If a visual is empty, widen your date range first — if it’s still empty, it likely means no session data exists for that period yet. And most views are anonymous session roll-ups — Smart Link Tracking and widget-form email capture are the two ways to identify a specific viewer.
The four tabs, left to right:
- Individual Experience — one tour’s story: average session time, sessions, CTA clicks and where they happen, bounce points, per-widget time, and discovery responses.
- Aggregate Experiences — your whole library at a glance: totals, trends, and your top five tours by sessions, CTA clicks, and owner.
- Individual Demo — the same lens applied to a single demo flow.
- Aggregate Demo — demo flows across your account.
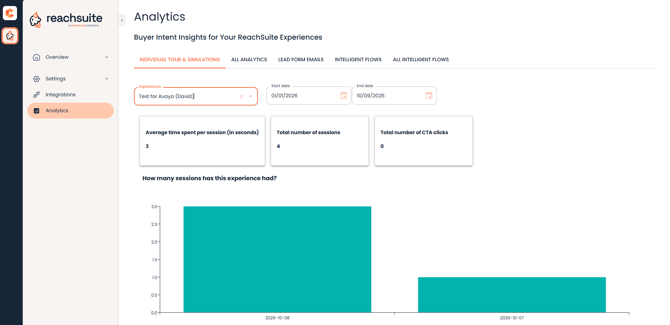
Analytics dashboard, Individual Experience tab]
| Part 3: Reading the Signals (For AEs and SEs) |
- Time per session — treat like time-on-page; the higher it climbs, the stronger the interest.
- Rising session counts — often your champion sharing the tour internally; that’s a buying committee forming.
- CTA clicks — each one is a hand raised for the next step.
- Bounce points — where buyers consistently drop; if the same step keeps losing people, tighten or cut it, and send the insight to product and marketing.
- Discovery responses — straight-from-the-buyer intel; bring it to the next call.
The pattern to act on: rising sessions + high completion + a CTA click = a buyer who’s ready. Don’t let that one sit in your queue.
| FAQ |
Why don’t I see stats for a tour I know was viewed? Two usual causes: Demolytics tour stats cover views recorded after April 8, 2026, and the analytics dashboard’s date range defaults to today — widen the start date.
How often does the data refresh? The tour analytics dashboard refreshes hourly, on the hour.
Can I see who viewed my tour? For demo-delivered tours, Demolytics ties engagement to your DemoBoard recipients and discovered stakeholders. On the dashboard side, most data is anonymous session roll-ups — Smart Link Tracking and widget-form email capture are the two ways to identify a specific viewer.
What’s a “good” completion rate? There’s no universal benchmark — trend beats target. Watch your own tours over time: rising sessions and steady completion mean the content is working; a step where completion consistently drops is your edit-me signal.
A visual on the dashboard is empty. Is something broken? Usually not. Widen your date range first (the dashboard defaults to today) — if it’s still empty, no session data exists for that period yet.
| Related Articles |
Adding Tours to Demos & Sharing · Getting Started with Consensus Tours · Basics of Track DemoBoards